My Sysmon use cases were mostly around analyzing malware activity in a sandboxed environment, where in the past, I had to orchestrate few utilities to collect process and network activity logs from various sources. The issue with this approach is that sometimes the focus tends to shift towards organizing collected data more than analyzing it.
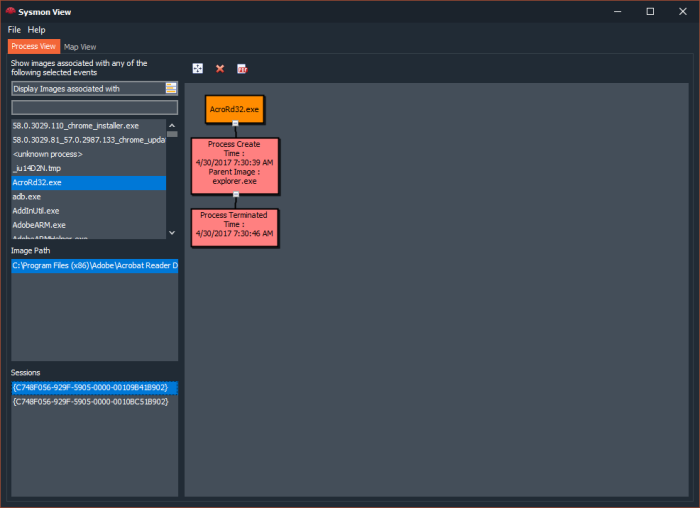
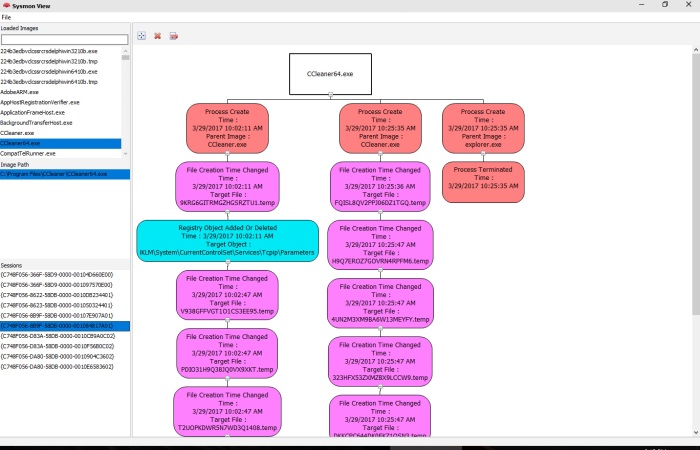
In the last update to Sysmon View, I introduced two new features:
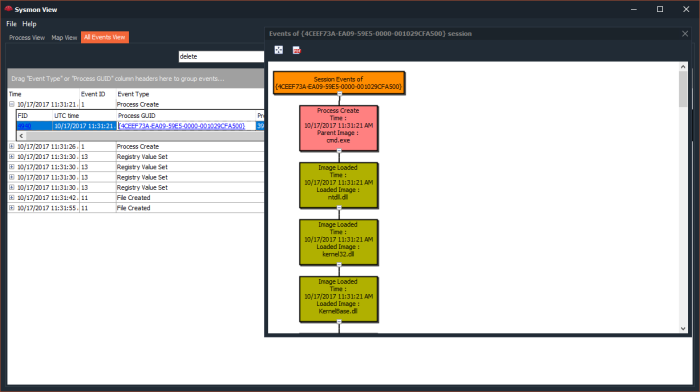
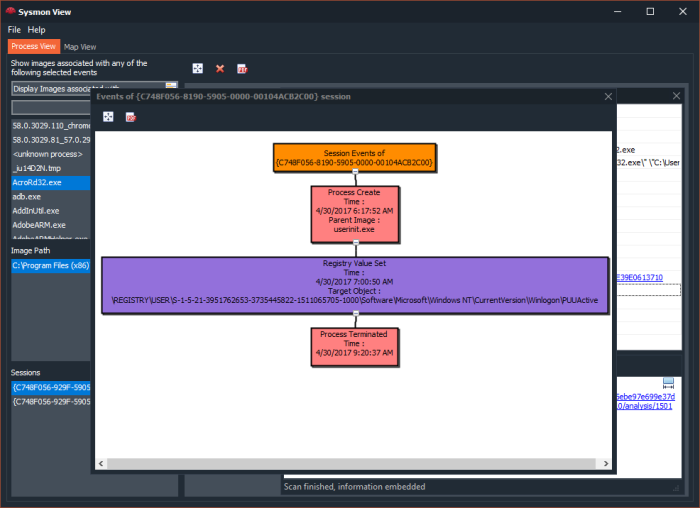
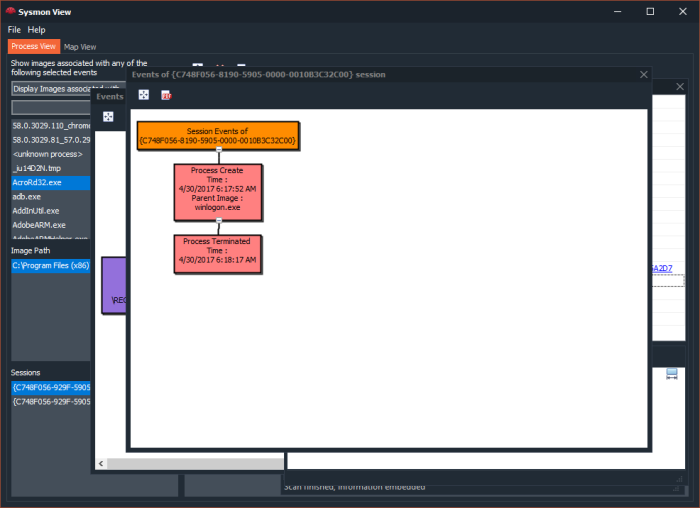
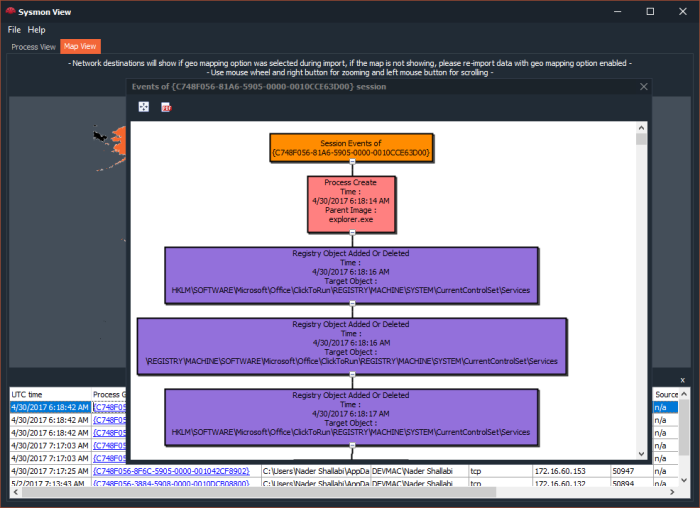
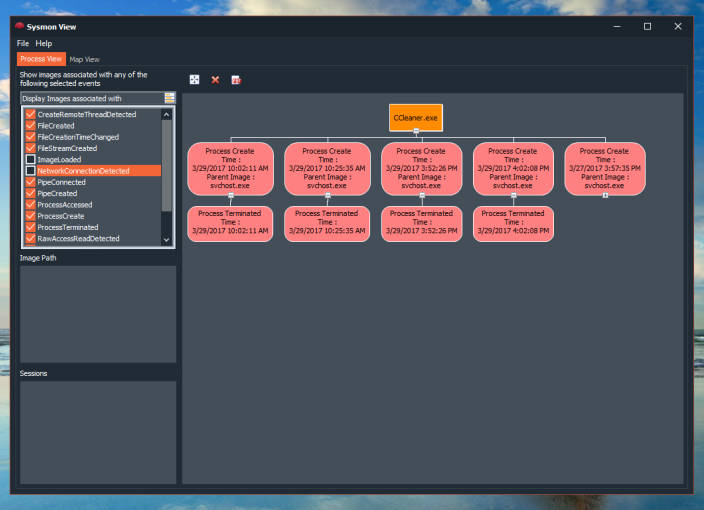
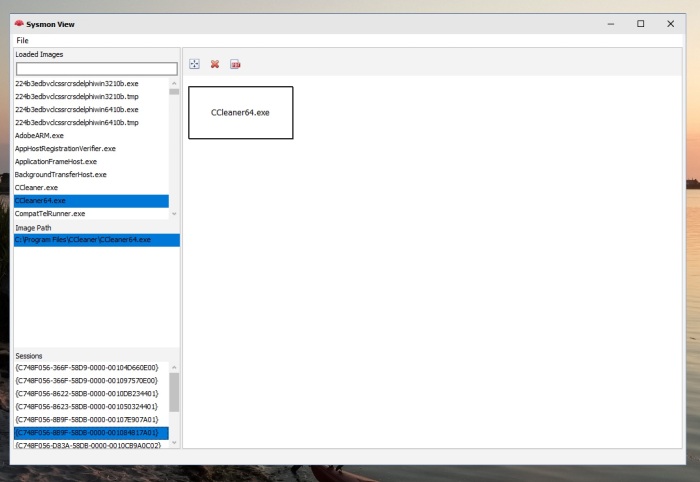
- Visualization of Process creation hierarchy.
- Ability to import network packet capture for correlation with the Sysmon Network event
The second feature helps in advancing analysis, by looking up the packet payload data, tracing the entire network session conversation or even analyzing the usage of a non-standard ports (MITRE T1065).
Importing a network capture file
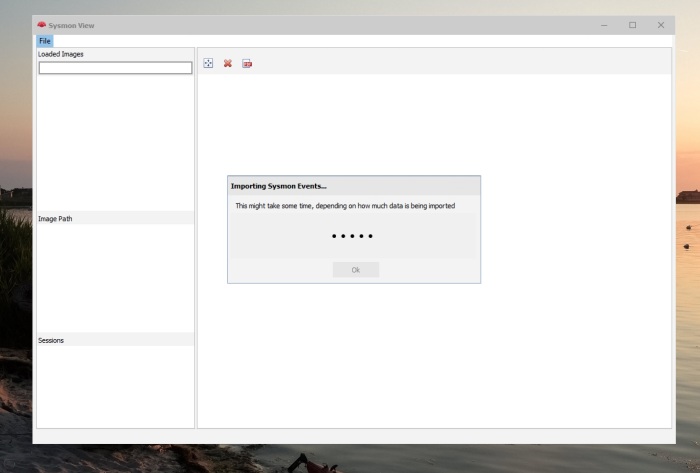
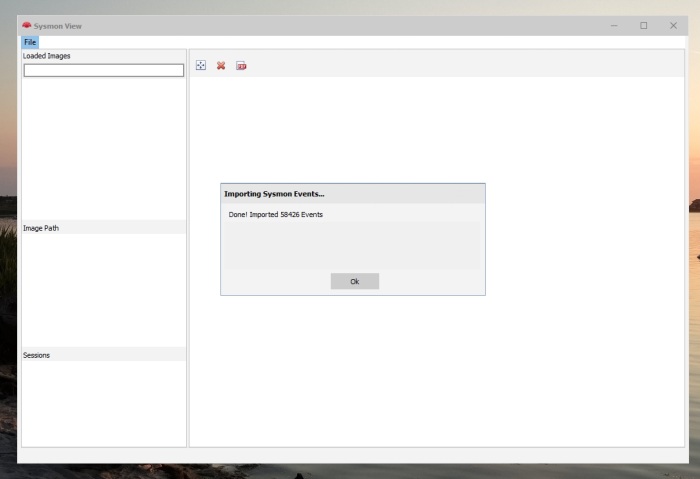
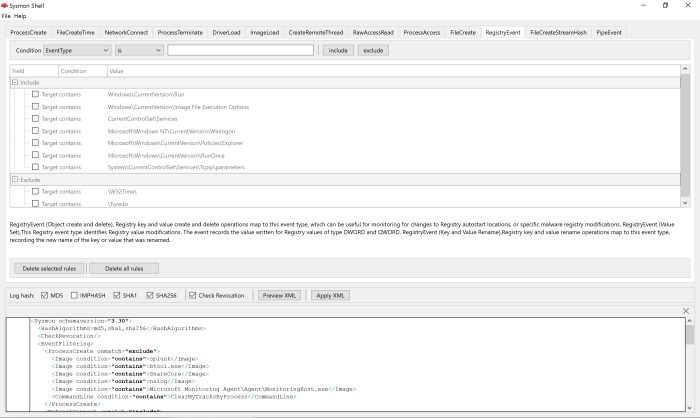
To experiment with the packet import functionality, we need an exported XML from Sysmon event log (check GitHub on how to import logs to Sysmon View) and a matching packet trace file (PCAP/PCAPNG, captured within the same events log time frame), once Sysmon logs are imported, add/import the network trace file:
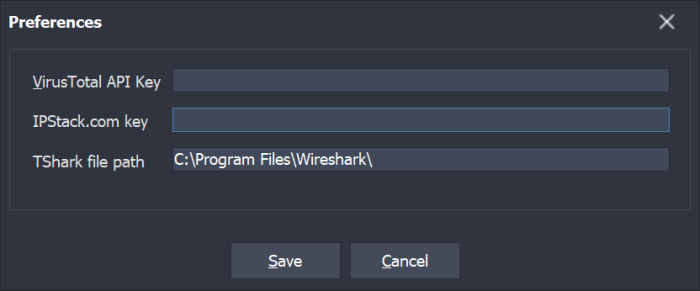
Tshark is needed for all of this to work, it is used to convert the PCAP/PCAPNG files into JSON format for parsing; it is also used to extract (filter) packets later. Tshark is part of the Wireshark installation, and its path must be set in Sysmon View preferences as shown here (Wireshark is also needed to view extracted packets)
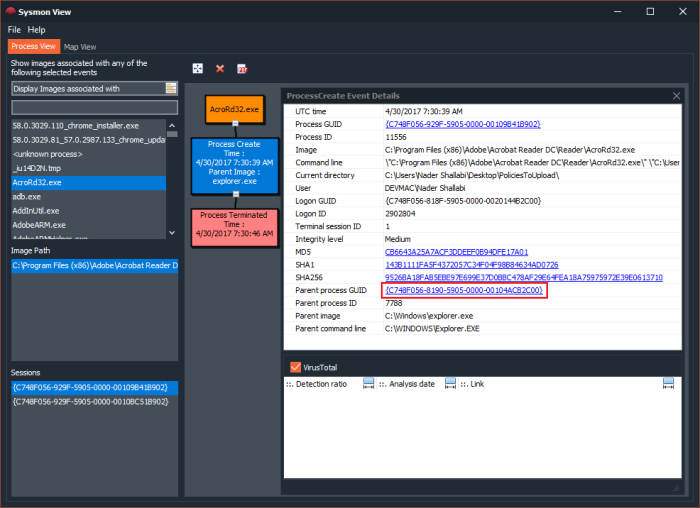
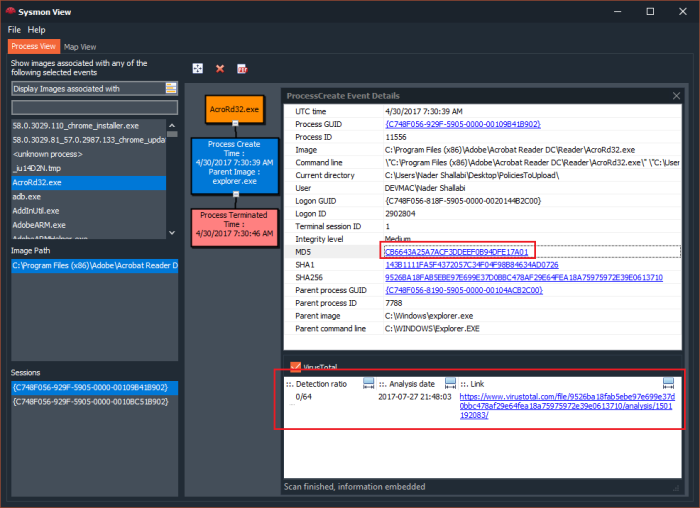
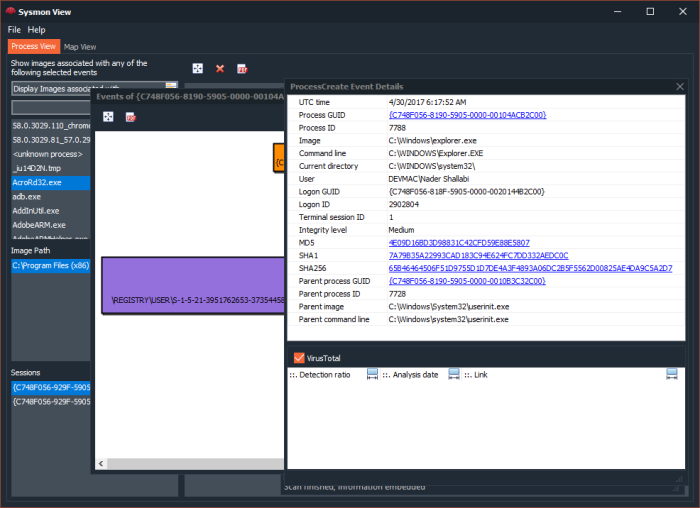
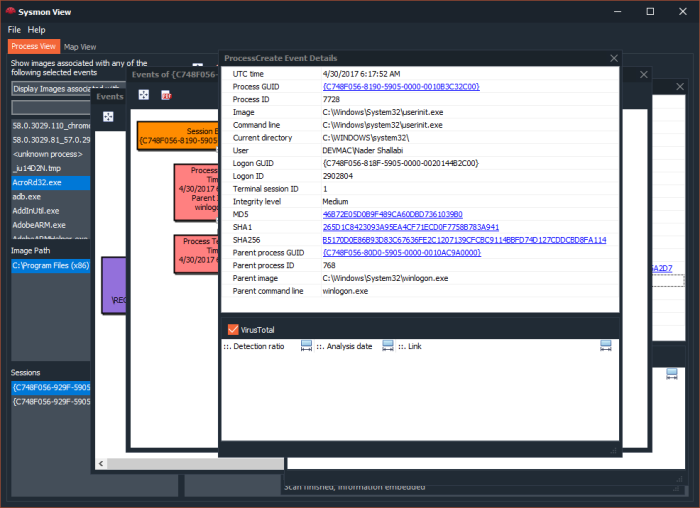
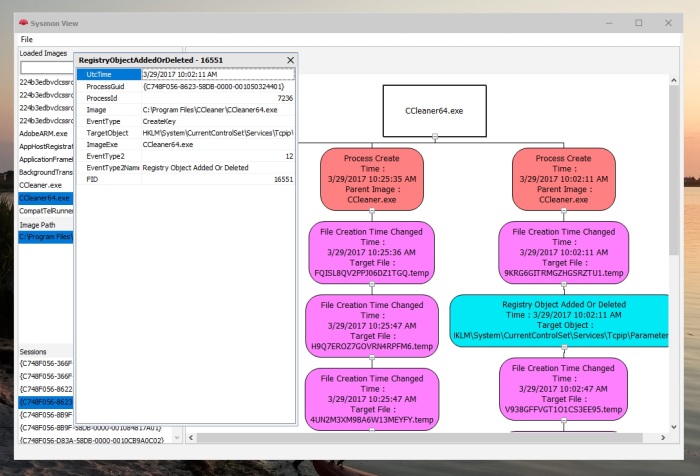
Upon successfully importing Sysmon events and network packets, Sysmon View will be able to correlate any Sysmon network events with a matching network conversation (packets), the event’s “details” box will display a link to indicate that a matching network capture exists for a specific event
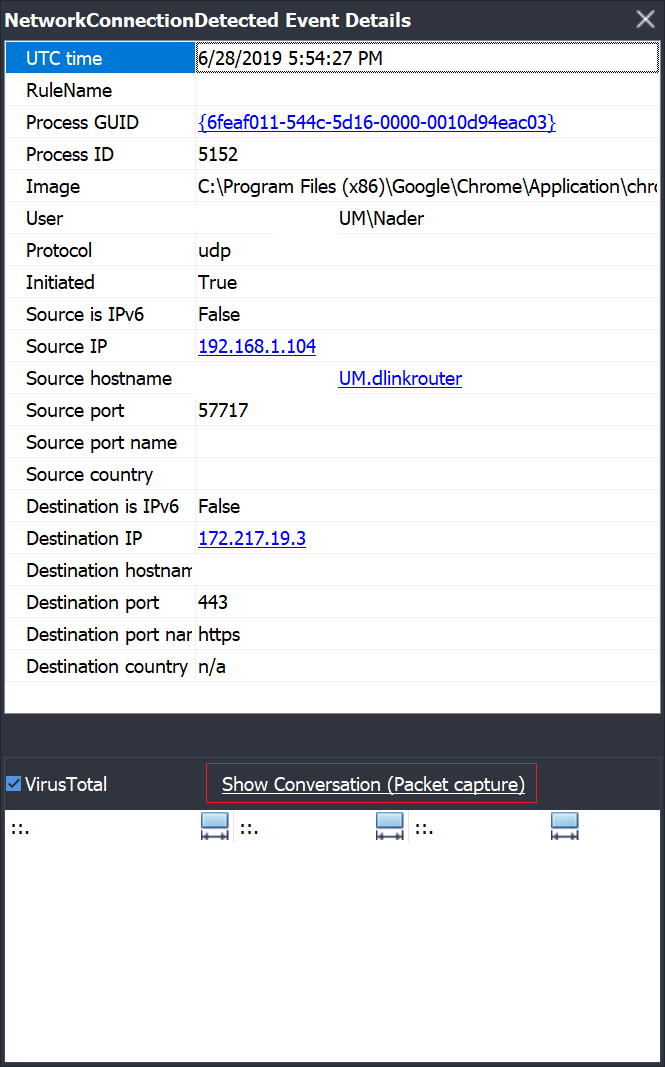
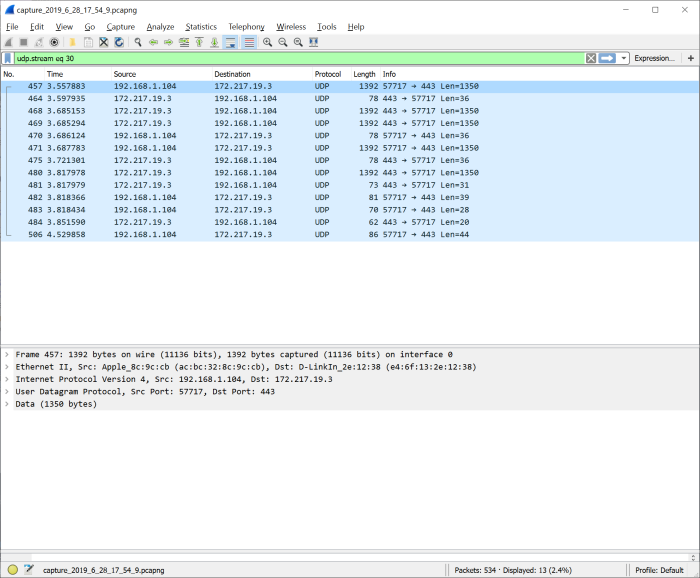
Clicking this link will run Wireshark with a temporary generated file (in the form of Capture_Year_Month_Day_Hour_Minute_Second.pcapng) with a Wireshark filter matching network event source, destination (IP and Port) and transport (TCP or UDP)
As mentioned earlier, a time-matching Sysmon and network logs need to be generated, to help make this task more productive, I created a small command line utility, “Sysmon Box”…
Sysmon Box
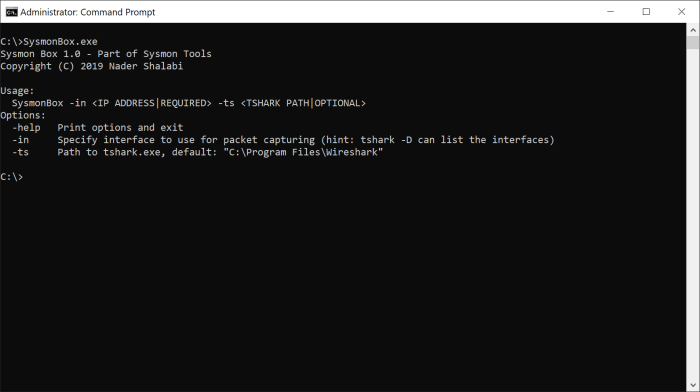
While testing Sysmon View I spent a good deal of time and effort trying to generate logs from both, Sysmon and Wireshark, so, to save time spent in orchestring the toolset, I created “Sysmon Box” to help in automating this process, here is a description of what the tool will do when running the following command (Sysmon needs to be readily installed):
SysmonBox -in Wi-Fi
- Start capturing traffic (using tshark in the background, this is why specifying the capture interface using the -in option is mandatory, it will be passed to tshark)
- Generate Sysmon and traffic logs, when done, hit CTRL + C to end the session
- Sysmon Box will stop traffic capture, dump all captured packets to a file and then export Sysmon events logged between the start and end times of the session using EVT utility
- Finally, it will build a Sysmon View database file (backup existing database, if any) with imported data, all you have to do is to run Sysmon View from the same folder or copy the database file (SysmonViewDB) to the same folder as Sysmon View (keep the captured packets files in the same location, they will be referenced by Sysmon View)
With Sysmon Box and View combined, you have a mini (tiny) sandbox utility for analyzing behavior at process and network levels.
Sysmon View Database
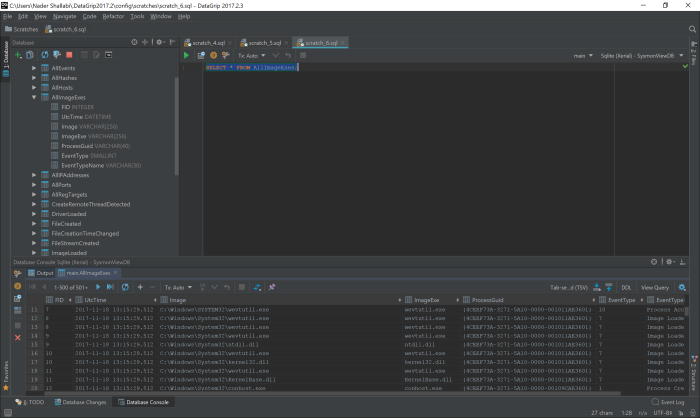
If you use Sysmon Box or Sysmon View to import data, you can skip using Sysmon View GUI and use the database directly for analysis, the database is a SQLite database that can be accessed by any free database client tool.
As an example, the following query is used to list all hashes captured by Sysmon
SELECT * FROM AllHashes
Here is the output
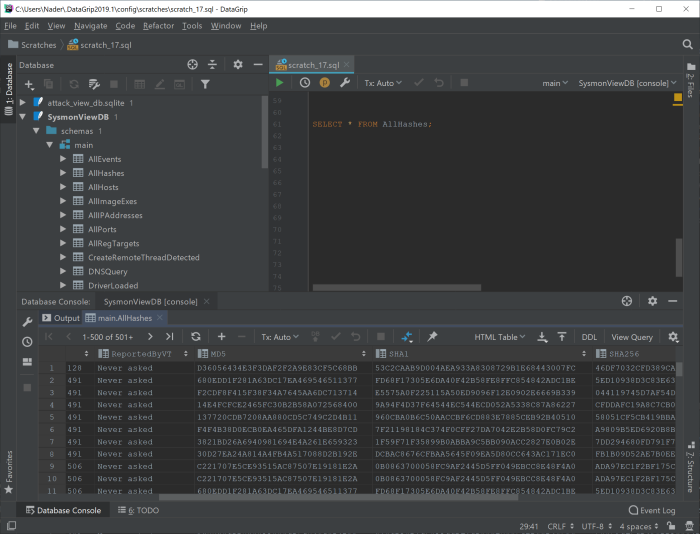
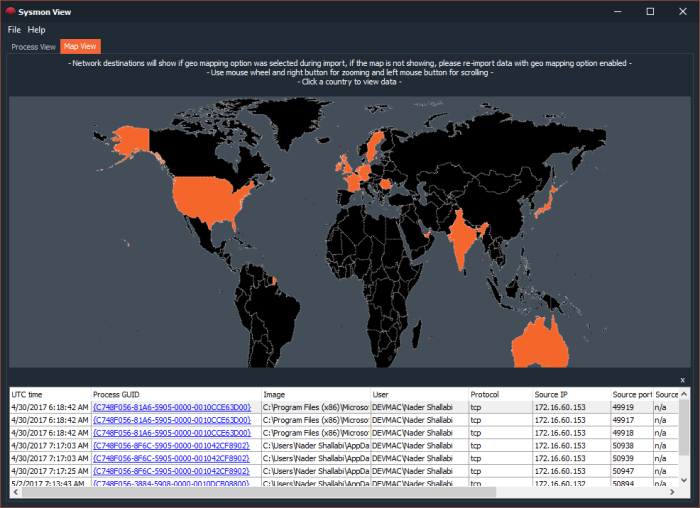
Similarly, you can extract other information, such as registry keys, DNS queries or do a full-text search or building more complex queries to identify malware behavior; the data model allows for correlating more data, beyond what Sysmon is actually logging (e.g. geo-mapping, VirusTotal ratings, network traffic, etc.). Additionally, this database file can be shared with other analysts, Threat Intel, etc. as a full “running session”.
Downloads
- The full data model for Sysmon View database is published on Github
- All tools are uploaded to Github
Stay safe.